When you want to have a fresh look at something, first step is to forget about all that you know about the concept in question. I am sure if you are reading this post now, you have heard about LLCR so just for the duration of this post, forget about all that you have stored in your brain and I will do the same.
Definition Loan Life Coverage Ratio:
Let’s google it and see what we get:

Ok, so to summarize:
- LLCR is a debt metric used by lenders to evaluate and monitor
- Lenders use it to see if the project future cash flow is robust enough to repay back their outstanding loan
Loan Life Coverage Ratio from Legal perspective
I just did a quick word search in a loan agreement for a project finance deal and here are the extracts:
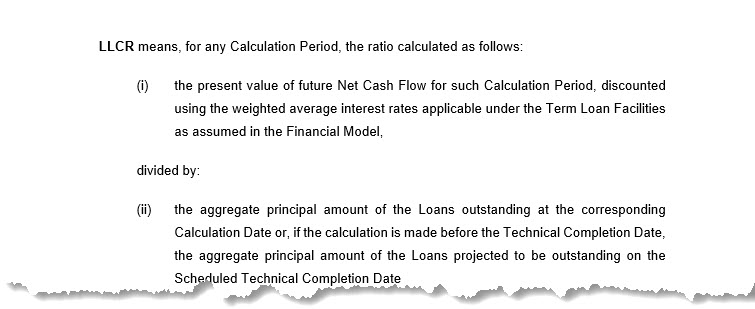
If I put the above in mathematical terms, this is how LLCR is calculated:

Note that this is one definition of LLCR. I have come across other versions as well. For example, LLCR is sometimes calculated as the net present value of cash flow available for debt service over the net present value of debt service. So when you are in a meeting with lenders and they discuss about LLCR, then always ask them how they want the LLCR to be calculated. I would even go further and ask for an example so that you replicate exactly how they want you to calculate the LLCR.
Ask and it shall be given…
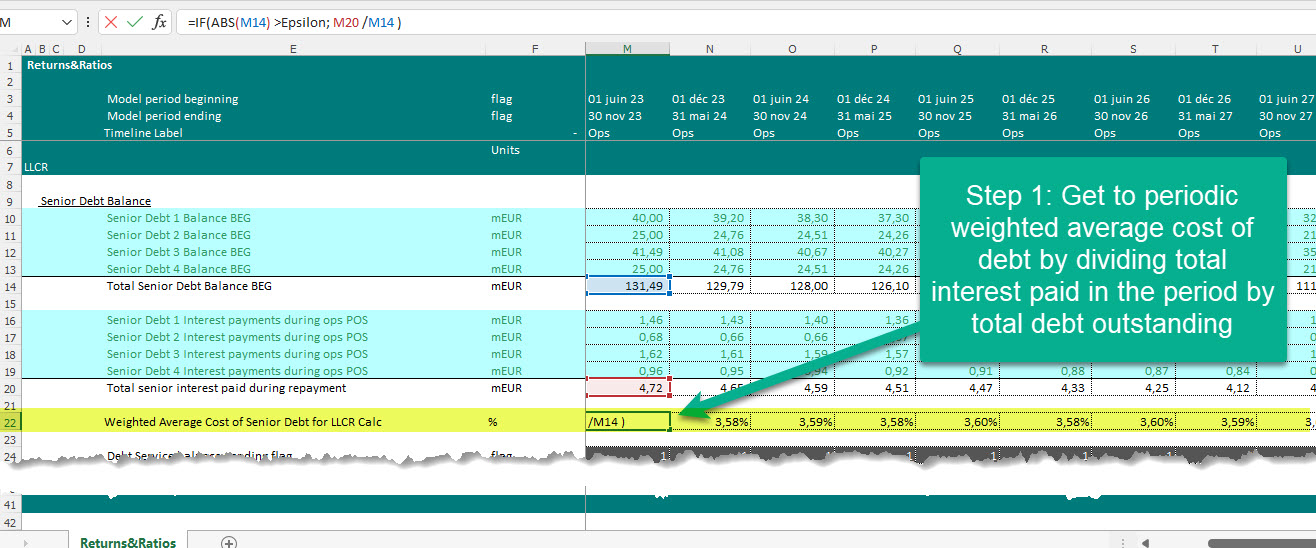
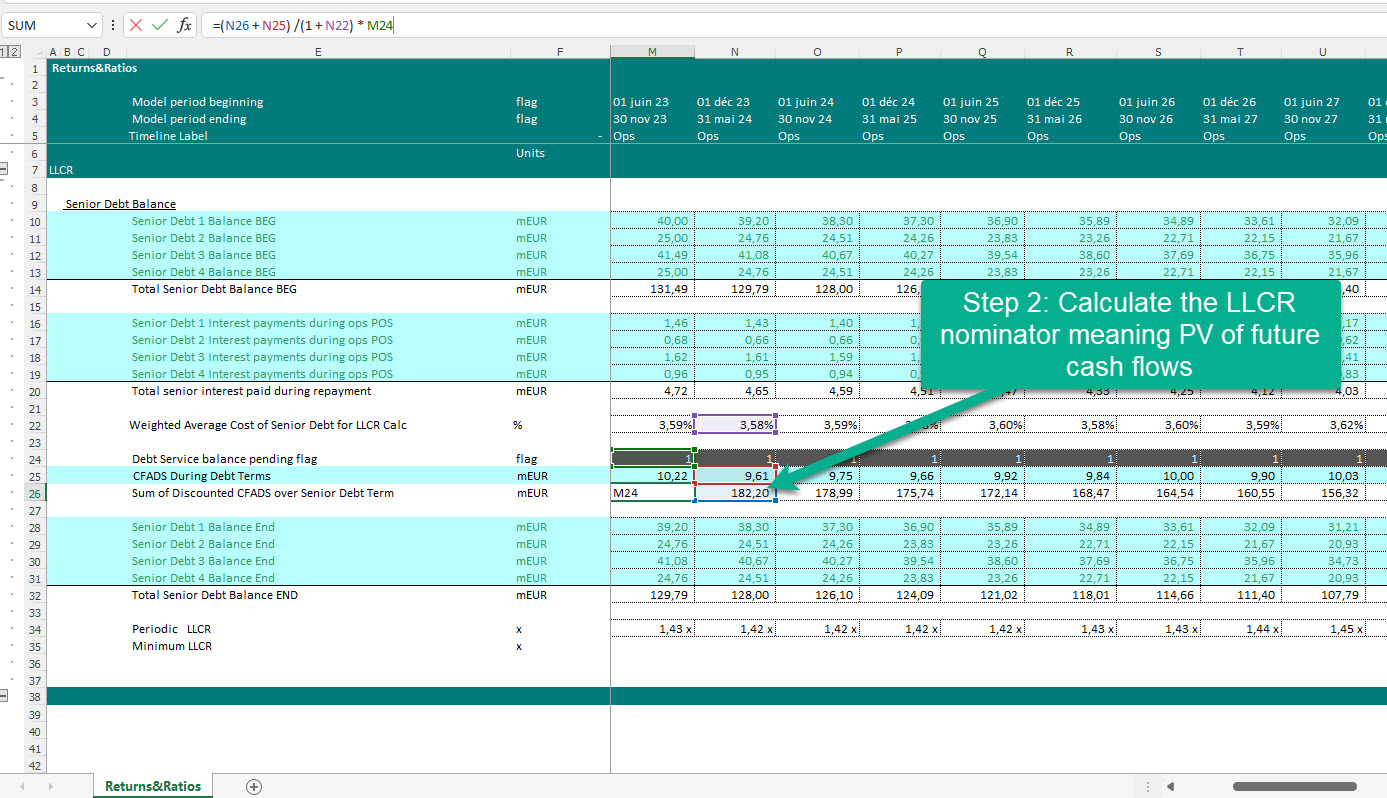
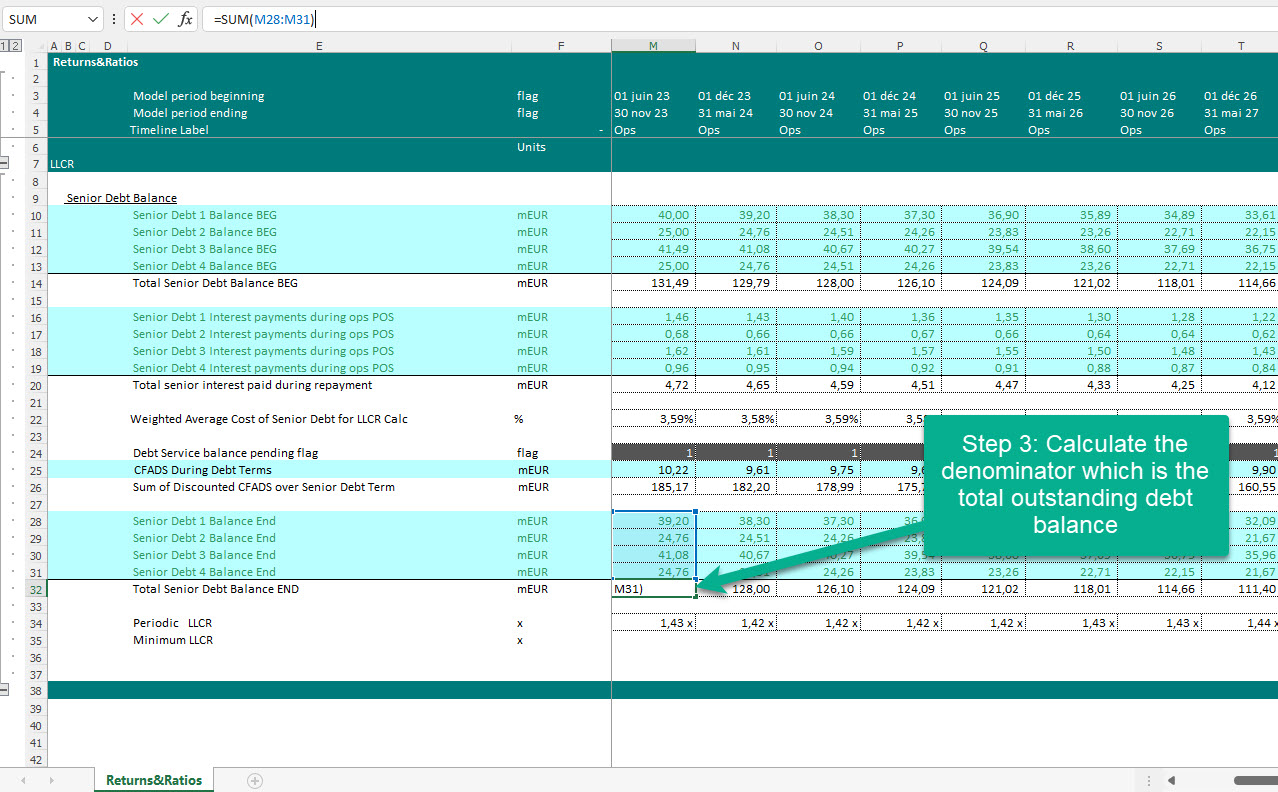
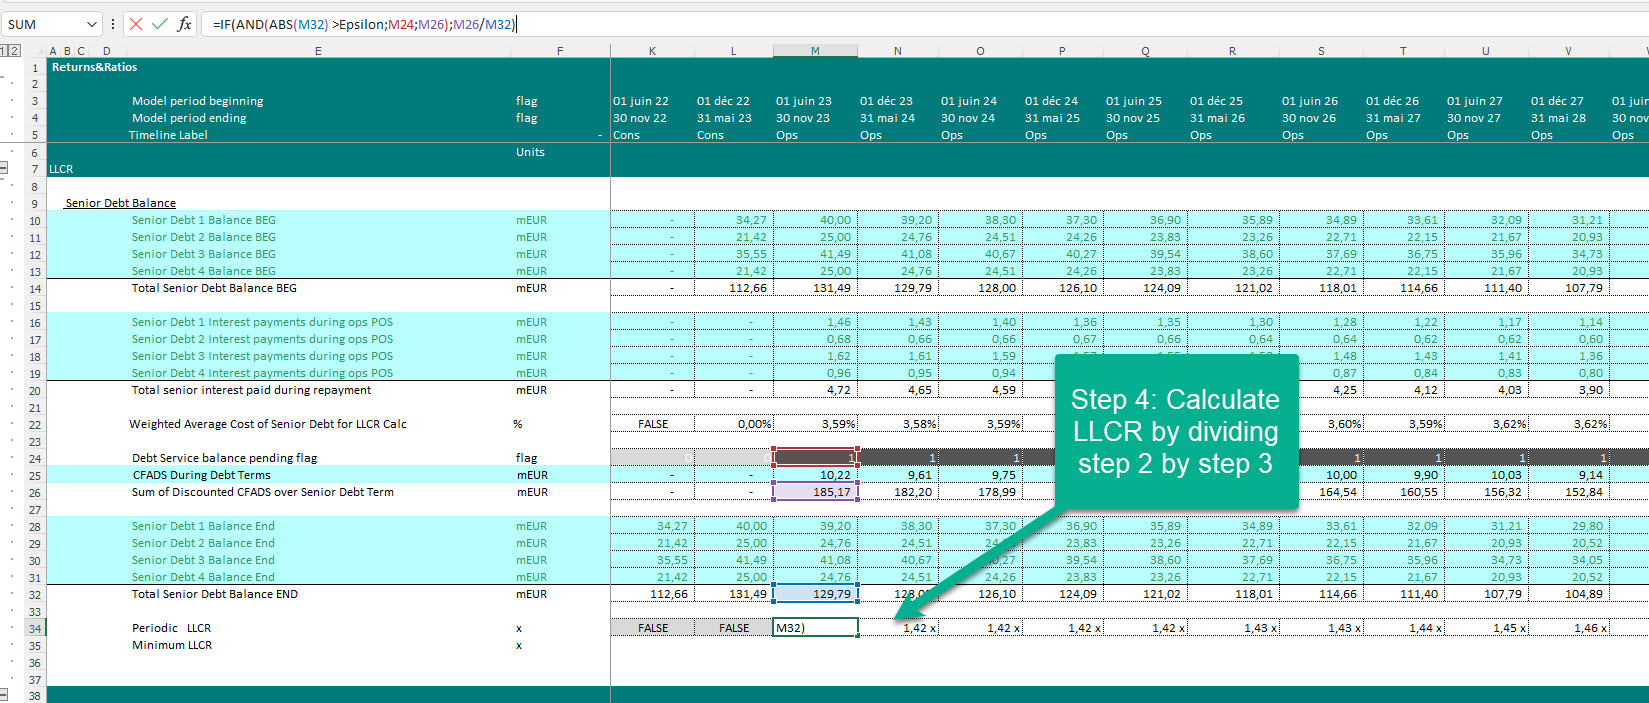
How to calculate LLCR?
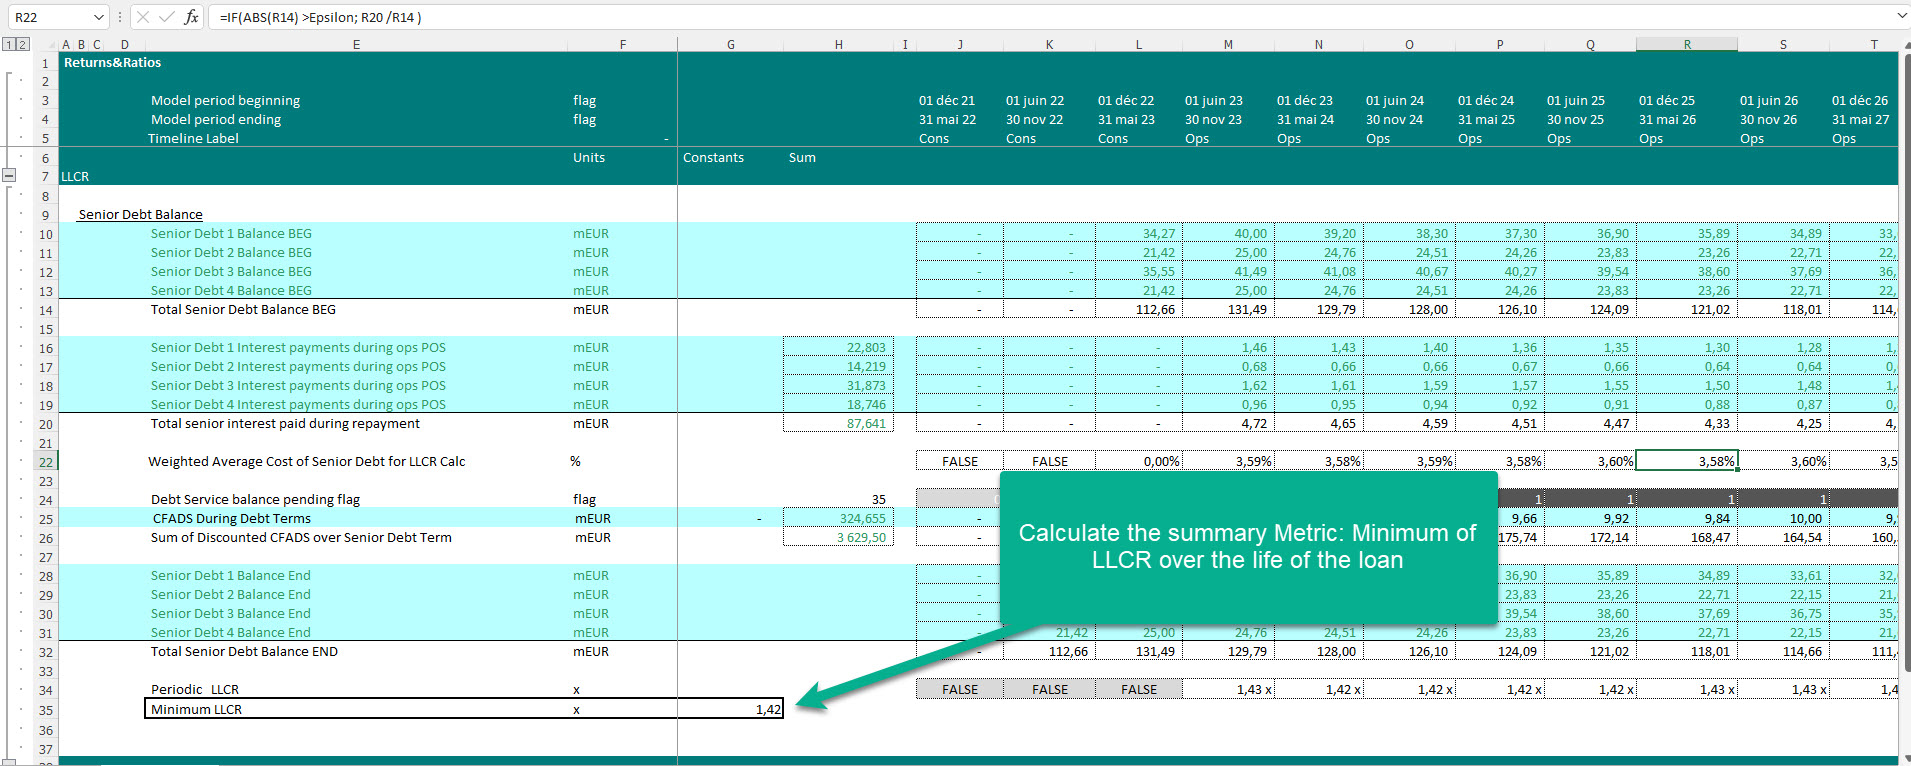
Let’s now dive into Excel and look at a real example:
Interpretation of LLCR
But what does LLCR really mean?
In the above example, we have a minimum LLCR of 1.42x. what does this mean? The cash flow available over the life of the loan on discounted basis is almost 1.4 times the amount of outstanding debt balance.
Can we push the interpretation a bit further?
Yes, we can do it by looking at the break-even LLCR point meaning to calculate “By how much should the CFADS go down to make the LLCR equal to 1x”. in our example of minimum LLCr of 1.42x, we can say that if the project cash flows go down by 30% we will then reach a situation where the discounted cash flows are enough to pay back for the outstanding loan.
In other terms, I would say LLCR is a long term debt metric and tells you that whether the cash over the remaining life of the loan is enough to cover for the outstanding loan. DSCR is a shorter term indicator as it tell you about maximum 12 months of cash flow availability to repay the upcoming debt service.
How important is LLCR for lenders? I have never come across a single deal where lenders did not require a min LLCR as part of their covenants. However for the purpose of debt sculpting, we mainly use the min DSCR as a constraint but you should always keep an eye on LLCR when you are sculpting your debt. If you have a back-loaded repayment profile, then this means that you might be targeting higher DSCR in the early years and eventually sculpting to reach the minimum required by lenders and in this case your average DSCR will be higher than LLCR. If however, you have a case where you pay more in the early years, then the LLCR will be higher than your average DSCR. So moral of the story, always check and keep an eye on Min DSCR, Min LLCR and average DSCR and put checks in your models to flag if any of these ratios goes below the threshold required by lenders.
That’s it for me for this one. To be honest with you I am running out of inspiration for my next blog post. Here are the topics I have in mind:
- Project Life Cover Ratio
- Different sources of concessional funding
- Debt sculpting
- Professor Edward Bodmer’s Parallel model
What do you think?
