Sometime financial models are accompanied by two other documents:
- Financial model Guide or manual
- Financial model Assumption book or databook
Sometimes the guide and assumption book are combined as one.
My issue is not with the worth of these documents. I fully agree that they are quite useful.
- the guide will show an overview of the model mechanics and functionalities and make it easier for the user to understand how to work with the model. If it is done well, a model walk-though is not even required.
- an assumption book will present the key model assumptions and results and will make it easier to present key model information.
My issue is having this information in a separate document. I rather include it within the financial model in a dedicated sheet that I call “Guide”.
In this post, I want to take you through a typical project finance “Guide” sheet. You can download my suggested template and adopt it in your own project finance models.
Download Financial Model Guide Sheet for FREE
To summarize, the benefits of including a guide sheet within your financial models are:
- It’s going to avoid updating different documents when sending new model versions. If you or your client or colleague still insist on sending a separate documents explaining the model functionalities, then you can simply print the Guide sheet sitting within your model as PDF (lazy financial modeling techniques).
- it will provide comfort to users when opening the model that the model is well structured and standardized
- it will remind the financial modeler or anyone inheriting the model that they need to respect certain color codes and column structure when updating the model.
- It might help busy investment officers to quickly extract information from it and use it in their own project documents.
Just a note that you do not link and use the information in guide sheet to do any calculations. It is just for reporting purpose and if you delete the sheet Guide from the model, it should have no impact on the model.
Now let’s look at the main sections of a typical guide sheet:
1. Model mechanics and structure
The first top section of the guide sheet should present the model functionalities and mainly the below sub sections:
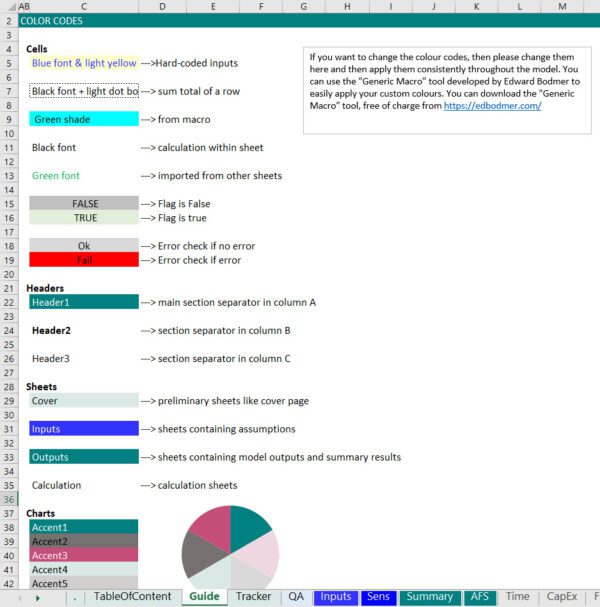
1.1. Color codes used in the Model:
Explaining the color codes used in the model. Can be as simple as just mentioning the color codes used for inputs that can be changed by user of the model or can be more detailed like the below example.
1.2.Worksheet column structure:
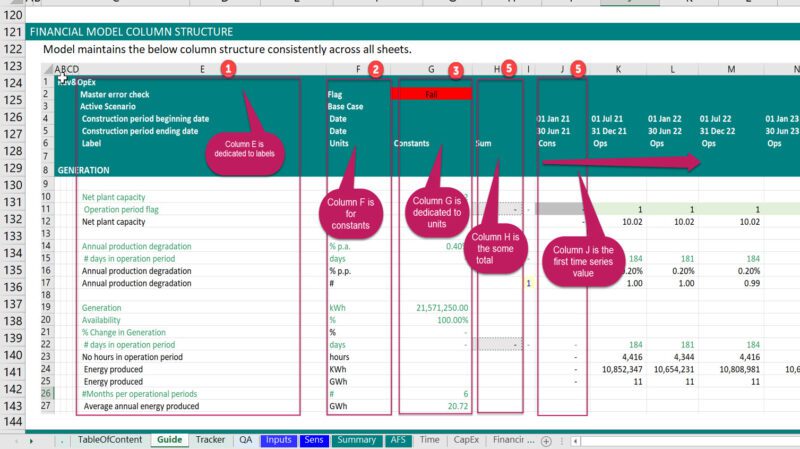
Explaining the worksheet column structure which should be harmonized across all worksheets within the model.
1.3.Workbook structure:
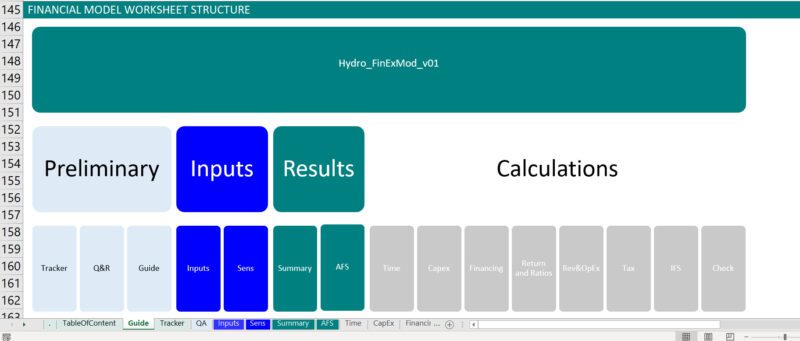
listing worksheets included in the model and with a short description. Can be presented in form of a table and also a flow chart (I suggest to include both).

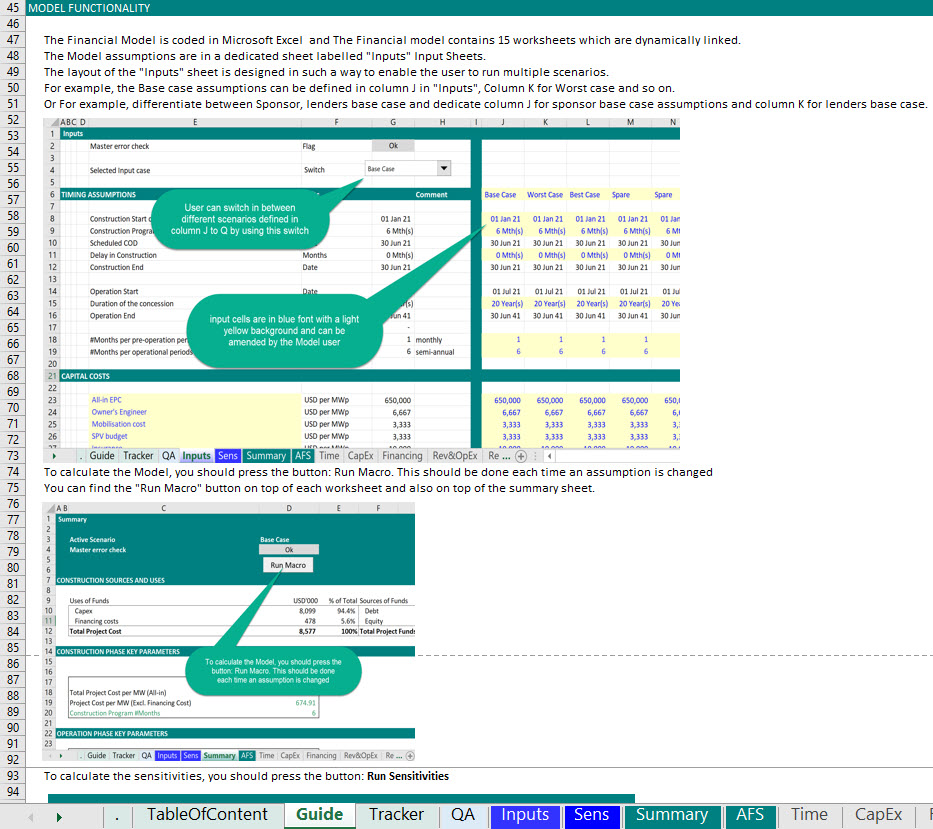
1.4.Operation of the model:
Explaining how to use and run the model. You can get some snapshot of the model and insert it as image to show which button user should press and when.
1.5.Macros:
List all macros included (Do not lock or password protect)

1.6.Checks:
List all check included in the model and maybe briefly explain each of them. For a complete guide on how to build error checks, check my suggested template.
Building Integrity Checks in Project Finance Models (Manual & Template)

1.7.Abbreviations:
List all definitions and acronyms even if it seems obvious to you that CFADS stands for Cash Flow Available for Debt Service.

2. Model Key Assumptions
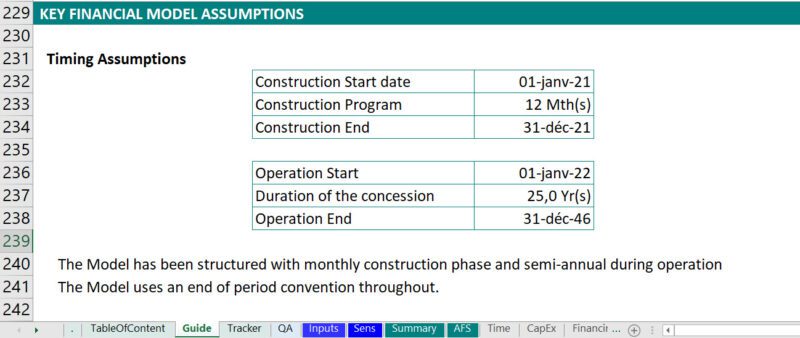
2.1.Timing assumptions:
The key base-case timing inputs summarized in a table.
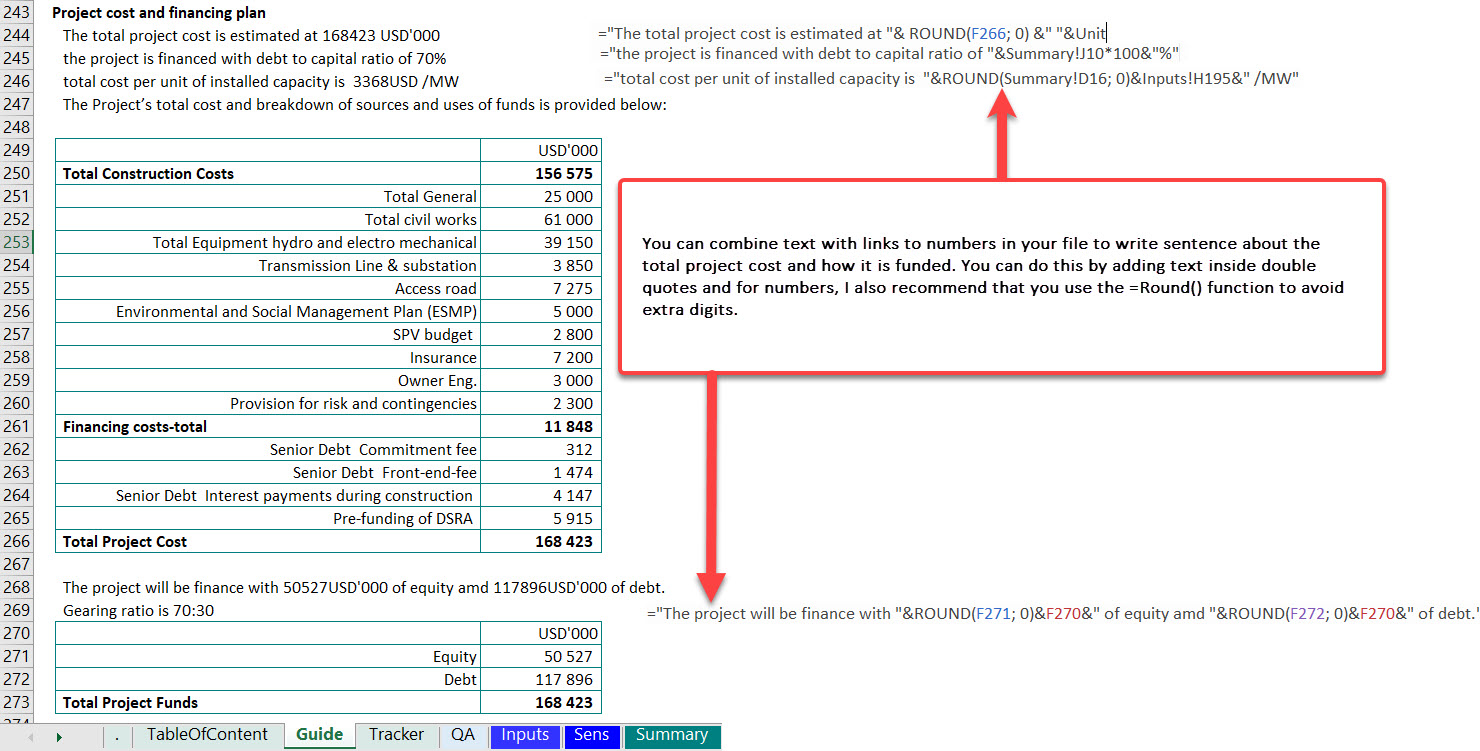
2.2.Project cost and financing plan:
A summary table and pie or clustered bar chart summarizing capital expenditure during construction and basically the summary sources and uses of funds. You can combine text with links to numbers in your file to write sentence about the key financial metrics and project financial viability. You can do this by adding text inside double quotes and for numbers, I also recommend that you use the =Round() function to avoid extra digits. Here’s an example:
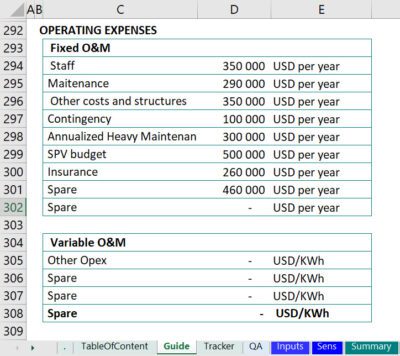
2.3.Operating Expenses:
Summarizing Operating expenses mainly on annual basis. You can report the average over the life of the project or the annual Opex in the first operating year.
2.4.Revenues:
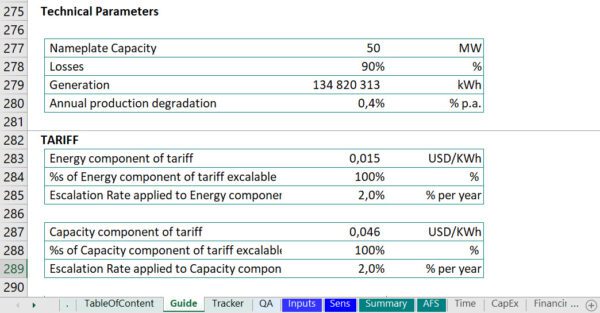
Report the main technical and financial assumptions behind the revenues and also report the average annual revenues.
2.5.Debt assumptions:
Summarize debt terms in a simple table.

3. Model Key Results:
You should already have all the information you need in this section in your summary sheet but it’s ok, you can replicate the same here and add a sentence or two especially in the commercial viability section. This will help the user to just simply copy and paste the whole section in a document.
3.1.Commercial Feasibility:
You can combine text with links to numbers in your file to write sentence about the key financial metrics and project financial viability. You can do this by adding text inside double quotes and for numbers, I also recommend that you use the =Round() function to avoid extra digits. Here’s an example:

You just need to make sure that when you are printing or sending, you are reporting the base case figures.
3.2.Sensitivity results:
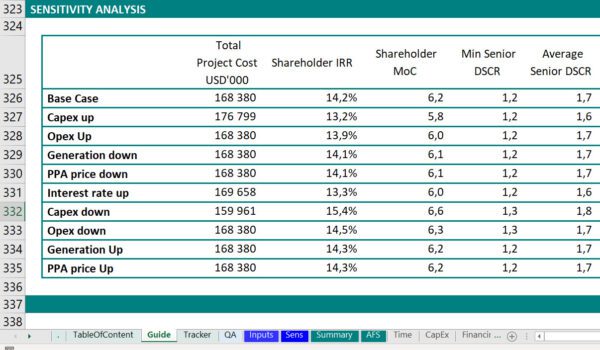
In most project documents, under the project financials, they also have a section for sensitivities. All the above sections should reflect the base case assumptions and results but then in this section, you report the key metrics under some stress cases. If you don’t have sensitivity in your financial model, then have a look at my sensitivity template. You can easily integrate it within your model and simply link the sensitivity output table here.
As you can see in order to have all the above sections in your guide sheet, you need to have a structured model containing color codes, unique column structure within all worksheets, well designed Input sheets and all important financial modeling best practices. If you want to learn more about how to build a well designed and structured project finance model, check out my online course.

